Sunday, March 12, 2017

Using Pix4D with Ground Control Points (GCPs)


Introduction

Last week, imagery was processed with the software suite Pix4D. The same was done this week, however, this time Ground control points (GCPs) were used. GCPs are surface points on the Earth that have a known location. In this lab, GCPs were added to the imagery after initial processing and before final processing. Doing so added accuracy and thus, additional value to the final results.

Ground Control Points

The use of GCPs involves placing physical, conspicuous markers throughout the area from which the imagery is derived (Figure 1). They should be spaced at well-thought, general intervals around the perimeter and throughout the area. In this case, the ground control points are approximately 2'x2' squares of 1/2" plywood. Alternating bright yellow and black triangles make an 'hour-shape' or 'X pattern.'

Figure 1. Image of GCP


Method(s)

Pix4D was again used to process the Litchfield Mine imagery as was in a previous lab. The data from two separate flights were processed as one. Pix4D has the functionality to either process both flights at once (Figure 2), or process each and then merge them together. When harvesting and processing data with multiple flights, there must be an ample amount overlap (Figure 3) in the imagery to ensure a quality product.

Figure 2: Quality report image of 2 merged flights

Figure 3: Ample amount of overlap in flights sample


Before initial processing, the GCPs were added by importing the GCP file. The GCP file is a text file that contains the Y, X, and Z coordinates of the GCPs that were obtained while in the field. Once imported into Pix4D software (Figure 4), initial processing of the imagery began.

Figure 4: 'Import GCPs' functionality in Pix4D 


Once initial processing was done, GCPs then needed to be "tied down." One can see in Figure 5 that there exists an issue with the software when processing imagery from the DJI Phantom 3. The altitude is incorrect and each GCP's elevation populates above the surface model. Each GCP needed to manually have imagery corrected and validated as to where each individual GCP exists.
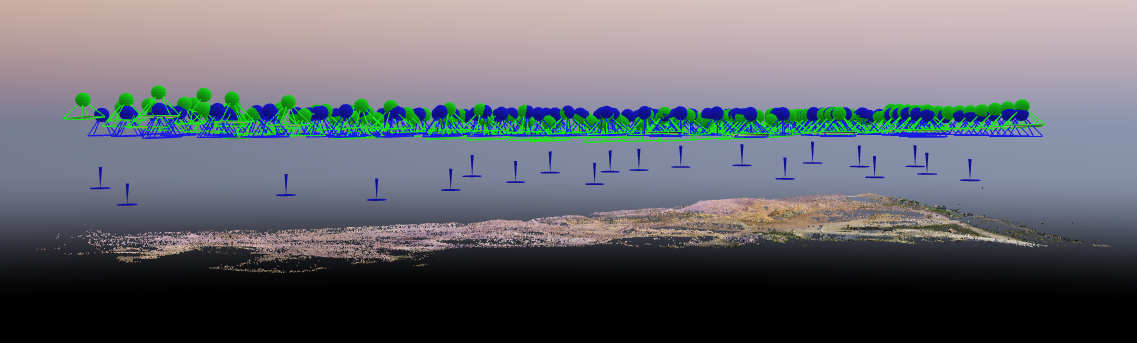
Figure 5: Elevated GCPs (blue markers) above surface model


Each GCP selected had 2-8 pictures that the Pix4D software recognized as including that same GCP (Figure 6). The task was to then locate the GCP square in the imagery, zoom in very close into the center of the GCP and then mark it (Figure 7). By doing so, the software was trained as to where the GCPs were. The more pictures that were georeferenced the GCP to, the more accurate the final result of each GCP was.

FIgure 6: Pix4D recognizing GCPs in imagery

Figure 7: Zoomed in center of GCP for marking


Once that process was completed corresponding to the GCPs, the imagery then needed to be reoptimized. The reoptimization function allows for Pix4D to then "tie down" (Figure 8) the imagery to the appropriate elevation. Once reoptimization was complete final processing began. The final quality check indicated the processing was sound (Figures 9 and 10). The data rendered after, was then ready to have maps made in ArcGIS.

Figure 8: Orange lines illustrating the 'tying down' of a GCP

Figure 9: Green cones overlapping blue GCPs indicating their correct position in surface model
Figure 10: Final quality check report image

Maps


Conclusion

There is an area on the south side of both maps where the data is distorted. This is due to the forest line and vegetation skewing the data (Figure 11). 

Figure 11: Forest line skewing section of Ortomosaic (left) and DSM (right)

Overall, GCPs added value and accuracy to the final product. One must be diligent in the field in planning GCP points and obtaining quality GCP data as its accuracy is essential to the process.

The quality report (Figure 10) states that there was a 1.01% relative difference between initial and optimized internal camera parameters. The larger the area, the greater the impact of accuracy. In this case, the surveyed area has a rough, approximate diameter of 500 meters. While 1% may not sound far off, 5 meters is a large amount in an industry where commercial-grade outputs sometimes see sub-centimeter accuracy.  

The issue that occurs with DJI Phantom imagery and the elevation level of GCPs is unfortunate. The step of having to manually tie down the GCPs in Pix4D took a large amount of time. In a real world application, one would want to fully process a project of similar size, in about half of the time.

Monday, March 6, 2017

Using ArcGIS Pro to engage in Value Added Data Analysis

Introduction

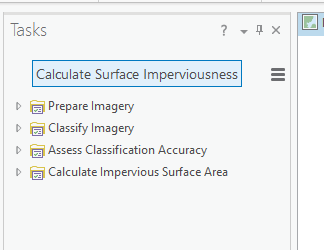
For this project, I am to take the following ArcGIS online mini-lessons to calculate pervious and impervious surface area, and then classify an aerial image that determines surface types:


  • Segment the Imagery
  • Classify the Imagery
  • Calculate Impervious Surface Area


Once done, the surface types allow for easy user and consumer delineation of the data for all types of purposes.

Steps


The course allowed me to download all of the data necessary into my student folder. 


To calculate surface imperviousness I needed to complete all of the steps above. 

Segmenting the Imagery

First I needed to prepare the imagery. This task is a 3 step process consisting of segmenting imagery on the fly, reviewing the segmentation, and segmenting the imagery with geoprocessing. Below you can see the extraction of spectral bands into an image with only 3 spectral bands. This process makes classifying the surface area much easier in the next step.


Classifying the Imagery

To classify the imagery, I needed to use ArcMap. There is was able to find like areas such as roofs, driveways, roads, bare Earth, and grass, and use a classification tool to identify them as such. The tools allows me to draw rectangles on those objects. The inside area of those rectangles identify colors of like characteristics in the image and I was able to rename their classes appropriately and assign appropriate colors.


 I then needed to use the reclassify tool to help differentiate natural (pervious), versus man-made (impervious) objects in the imagery.


Calculating the Impervious Surface Area

To calculate the impervious surface area, the lesson had me generate 100 random points and then assign the first 10 pervious (1) or impervious (0).


Next, a confusion matrix was utilized to help determine the accuracy of the raster data.


At this point, the land parcel's impervious areas are ready to be calculated, using the Tabulate the area tool.


 Once tabulated, and joint with the parcels layer, impervious surface analysis imagery is created. I changed the symbology colors to match what was in the lesson.


Map


Conclusion

ArcGIS Pro is the successor to ArcMap. I haven't had much experience with either software, so a comparison wouldn't be appropriate or thorough. Using ArcGIS Pro is a great tool to add value to data and imagery. Again, I've only scratched the surface with the functionality of the software. I can easily see though, how presenting the data in various ways, such as reporting impervious versus pervious surface imagery could be used in commercial applications. I'm excited to see what else it can do!

Processing Pix4D Imagery


Part 1: Getting familiar with the Pix4D

Look at Step 1 (before starting a project). What is the overlap needed for Pix4D to process imagery?

Generally speaking, the recommended overlap for most cases is at least 75% frontal overlap (with respect to the flight direction) and at least 60% side overlap (between flying tracks).
When flying over trees and dense vegetation, Pix4D recommends to increase the coverage to 85% and 70% side overlaps, respectively. This is due to the complex geometry associated with that environment.

What if the user is flying over sand/snow, or uniform fields?

Due to snow and sand having large uniform areas, they typically have little visual content. Pix4D recommends to use a higher-than-general overlap of 85% frontal and 70% side overlaps. They also advise to increase the contrast as high as possible. It may help to also increase the altitude when flying over areas with flat, homogenous visual content.

What is Rapid Check?

Rapid Check is a faster method of processing Pix4D data that reduces the resolution of the original images. It can be used for a couple of reasons. If the user wants to check the quality of images he or she wants to fully process quickly, they can run Rapid Check. If the rapid/low resolution process succeeds, they can assume the results of future, full processing to be high quality. The user can also use Rapid Check to intentionally create a lower quality output. If a lower resolution output satisfies their need, they can use it and save time in processing.

Can Pix4D process multiple flights? What does the pilot need to maintain if so?

Yes. Pix4D can process multiple flights, though the data collector needs to make sure that each flight plan acquires enough overlap in the images and that they are taken in similar weather conditions.

Can Pix4D process oblique images? What type of data do you need if so?

Yes. Pix4D can process oblique images as well. To do so, one needs data from multiple flights with images taken from between 10 and 35 degrees, with plenty over overlap. In that case, Pix4D will not create an orthomosaic. The use of ground control points (GCPs) or manual tie points are recommended.

Are GCPs necessary for Pix4D? When are they highly recommended?

While GCPs are not required to use Pix4D, they are highly recommended. If a user processed images that weren't geolocated in Pix4D and didn't use GCPs, the results would have no scale, orientation and absolute position information. Thus they couldn't be used for comparison, measurement, or overlay with previous results.


What is the quality report?

The quality report is a pdf document that is generated by Pix4D once processing is complete. The report allows the user to have a quality check on what's been processed by the software. Much information is included in the quality report, including image information, a preview of the processed imagery, data-set information, georeferencing, and more.

Part 2: Use the software


Pix4D is a photogrammetry software suite that uses images to generate 2D and 3D information, point clouds, digital surface models (DSM), digital elevation models (DEM), other terrain models, orthomosaics, textured models, and more.

  • Windows 7, 8, 10 64 bits.
  • CPU quad-core or hexa-core Intel i7/Xeon.
  • GeForce GPU compatible with OpenGL 3.2 and 2 GB RAM
  • Hard disk: SSD
  • Small projects (under 100 images at 14 MP): 8 GB RAM, 15 GB SSD Free Space.
  • Medium projects (between 100 and 500 images at 14 MP): 16GB RAM, 30 GB SSD Free Space.
  • Very Large projects (over 2000 images at 14 MP): 16 GB RAM, 80 GB HDD Free Space.


Pix4D allows civilian, lightweight, hobbyist drones to become mapping and surveying tools. A user can convert thousands of aerial images taken by an unmanned aerial vehicle (UAV)  into geo-referenced material including 2D mosaics, 3D surface models and point clouds. Pix4D software features advanced automatic aerial triangulation which is derived from the image content and unique optimization techniques.


The software is extremely user friendly. To demonstrate, Pix4D offers a "Demo Project" that users can practice with. For this project, I used instruction and course materials provided by Dr. Joseph Hupy from the University of Wisconsin - Eau Claire.


First the user simply adds the images they wish to be processed.


Once chosen, the user reviews the image properties window and makes any necessary adjustments. 


In this case, I made an adjustment to the "Shutter Model" to a Linear Rolling Shutter setting before moving forward.

Next, I chose from multiple processing options templates. For this project, 3D Map was chosen.


As a best practice, I chose to only have Pix4D conduct initial processing. All of the processing steps take time. Initial processing generates a quality report that can give the user confidence in the continuing of processing, and avoid losing time processing the remaining steps if the initial processing didn't produce satisfactory results. If the quality report shows that results are satisfactory, the user can then process the remaining data.


Pix4D also allows users to make animations of what's been processed.


Part 3: Maps


The above map is a DSM made with ArcMap from the result of processed imagery through Pix4D. The green areas represent the highest points of elevation.
The above map is an orthomosaic made with ArcMap from the result of processed imagery through Pix4D. Questions regarding the DSM or the orthomosaic can be referred to the other and compared to seek answers. I created one each of the second flight as well, shown below.
Conclusion

I've only scratched the surface in regards to Pix4D functionality. I have no experience with using GCPs or oblique imagery with the software. Thus, it is difficult to fully review the product. What I can say however, is that it is a very useful tool and the software is quite robust and user friendly. I'm impressed with how easy it was for me to process the imagery. 

While of course it can be used with images that came from most platforms, Pix4D does give a hobbyist UAS pilot an opportunity to create additional, more geospacially relevant data than they would be able to create without it or software like it. Pix4D adds value to the imagery being processed. 

Evaluation

1. Prior to this activity, how would you rank yourself in knowledge about the topic.

2-Very Little Knowledge

2. Following this activity, how would you rate the amount of knowledge you have on the topic

3-I know enough to repeat what I did

3. Did the hands-on approach to this activity add to how much you were able to learn?

4-Agree

What types of learning strategies would you recommend to make the activity even better?

Using GCPs

Monday, February 20, 2017

Constructing Maps with Processed UAS Data - Lab 1

* Why are proper cartographic skills essential in working with UAS data?

Cartographic skills are essential to have when working with UAS data. Those skills are needed to both accurately interpret the data and be able to present that data in a way that a general audience could use and understand. Data collected by drones for UAS purposes is typically more robust than what a hobbyist drone user gathers with their platform(s). When applied commercially, the presentation of that data requires cartographic skills to meet the needs of the client.

* What are the fundamentals of turning either a drawing or an aerial image into a map?

To become a map, a drawing or image must have a north arrow, a scale bar, a locator Map, and data sources. Without that information present, what’s presented is incomplete, and the user is likely unable to delineate the data accurately. The image is thus likely to not serve it’s intended purpose.

* What can spatial patterns of data tell the reader about UAS data? Provide several examples.

Spatial patterns allow us to interpret, deduce and delineate information. They are found in naturally occurring areas, like a formation of ridges in a mountain range, as well as manmade patterns like the distance between city blocks. The texture, color, value, shade, shape and other objects and patterns all serve as visual ques that better help the author precisely portray what’s intended and the reader to better discern what’s presented. When devoted to human applications, the study of spatial patterns can be valuable in many ways. For example, city planner can use the data to combat “food deserts” in urban areas.

* What are the objectives of the lab?

The main objective of this lab is to teach a sense of understanding and appreciation for the level of expertise and amount of work/study needed to present UAS data in professional manner that one could take pride in. In that, it is also intended to help one understand what’s needed for a drawing or an image to become a map. Another objective of this lab is to obtain practice with ArcGIS Pro, ARC Map, and ARC Scene software, geographic information systems applications that allow the author to farm and calculate, present, and manipulate, geospatial data.

What is the difference between DSM and DEM?

DSM and DEM stand for Digital Surface Model and Digital Elevation Model, respectively. A DEM is a bare-Earth elevation model, unmodified from its original data source such as LIDAR (Light Detection and Ranging) and an autocorrelated photogrammetric surface. The DEM does not count for vegetation, buildings, and other non-ground objects. Alternatively, a DSM would include the tops of buildings, trees, powerlines, and any other objects. A DSM is often called a ‘canopy model’ as it only sees ground where there is nothing else over top of it.

What is the difference between a Georeferenced Mosaic and an Orthorectified Mosaic?

A mosaic is a collection of images that are stitched together to create a larger image that collectively display more area than the individual images. Georeferencing is the process of taking images that are in known coordinate systems, and providing the data necessary for software to understand which coordination system it is in and where in it. An image is georectified to be georeferenced, a process in which an image is put into a coordination system it was previously not in. Orthorectification means to adjust precisely, an image in a known coordination system, with distortions that correct topographic variation. An orthorectified image displays a uniform scale throughout. A DEM of which has its pixel values represent the ground elevation above sea level is required for true orthorectification.


* What types of patterns do you notice on the orthomosaic? Describe the regions you created by combining differences in topography and vegetation.

When delineating the map, one can see many features. The image above highlights some of those features. The yellow oval represents the soccer field and the track around it. The area highlighted in purple show objects that are elevated, including some vegetation in the form of trees, and a man-made structure. The blue line shows the mid-point of the variation in elevation depicted in the legend. The blue squares show cracks in the ground as well.

Evaluation:


1.     Prior to this activity, how would you rank yourself in knowledge about the topic.

2-Very Little Knowledge. 

2.     Following this activity, how would you rate the amount of knowledge you have on the topic.

3-I know enough to repeat what I did.

3.     Did the hands-on approach to this activity add to how much you were able to learn?


4-Agree

Monday, February 6, 2017

Fixed-Wing Unmanned Aerial Systems (UAS) Report Regarding Coastal Monitoring Applications


UAS platforms are being increasingly utilized for various applications on coast lines. Coastal UAS operations include, but are not limited to, monitoring the stability of a coastline’s erosion, measuring the impact of flooding and other natural disasters, assessing cliff stability, applying data gained from coastal UAS operations to assist insurance agencies, communities, local environmental government agencies, such as the Department of Natural Resources (DNR), monitoring coastal vegetation, and assisting the Coast Guard. New applications (as well as platforms) arise, seemingly on a daily basis.   Deciding which one is right for you can be difficult.

This report is intended to be consultative in nature, comparing a few different fixed-wing UAS tiers and platforms and is thus, not comprehensive. When one thinks of UAS platforms, more commonly referred to as “drones,” one may immediately picture a multi-rotor platform. While there are many multi-rotor platforms that can satisfy many different commercial coastline UAS applications, fixed-wing platforms are generally faster, can cover a larger area, are typically more stable in high wind coastal areas, and enjoy longer flight times, so they will remain the focus in this report. Every platform decision regarding an intended UAS application should involve careful consideration. This report intends to help make that decision, be an informed one for you.

The platforms contained in this report are cost-tiered in ascending order. Many platforms have been researched and the following highlight one recommended platform for each tier. The tiers are Hobbyist, Mid-Level Commercial and High Level Commercial, respectively, and the complexity of the application the UAS platform is intended for has a direct, positive correlation with said tiers. Therein, information regarding their sensors (and potential sensors), mission planning software, range, flight time, top speed and other distinctive characteristics can be found, as well as what type of coastline UAS application may be best for each platform and tier.

Safety and adherence to all local, federal (FAA), national, international and maritime laws are imperative to successful UAS missions.


Hobbyist


MSRP: $1,299.00 USD (includes Parrot DISCO, Skycontroller 2, and Cockpit Glasses)

Sensors: Camera 14MP; Video 1080P HD; Altimeter; Ultrasound Sensor, Vertical Camera

Mission Planning Software: Parrot C.H.U.C.K. (Control Hub & Universal Computer Kit)

                The Parrot C.H.U.C.K. utilizes multiple sensors to assist with an automatic take-off and landing as well as assisted piloting.

Range: 1.2 mi (1.6km)

Flight Time: 45 minutes

Top Speed: 50mhp (80.5kph)

Distinctive Characteristics: Lightweight, compact, powerful.

The Parrot DISCO FPV has an aerodynamic and aesthetically pleasing shape. It is made from expanded polypropylene (EPP) and carbon tubes. It can be set up and ready for pre-flight procedures within 3 minutes. Once set up, the drone weighs in at 1.6lbs. While not recommended, additional sensors can be fitted onto the DISCO’s EPP frame. Doing so would require careful consideration so as not to greatly impact the aerodynamic qualities of the aircraft, would need to be extremely lightweight, and come with an understanding that any warranty would be voided. Modifications of this nature are much more effective and appropriate in the other tiers.
                While piloting can be done viewing through the cockpit with your smartphone or tablet mounted on the controller, flying the Parrot DISCO FPV is a much more immersive experience when coupled with the Parrot Skycontroller 2 and the Parrot Cockpit glasses. The pilot inserts the iOS or Android smartphone into the Parrot Cockpit Glasses to do so.
                The Parrot DISCO FPV is also compatible with the FreeFlight Pro application available for free on the AppStore and on Google Play. Users can record and store data of each flight and give them access to ‘Flight Plan’ to create automatic flights.
                This tier of fixed-wing UAS is going to be most typically associated with cinematic applications. Good uses include making travel/promotional videos, scenic photography, golf course fly-over hole previews, and various real estate promotional applications.


Mid-Level Commercial


MSRP: $15,180.00 USD 

Sensors: Avionics Sensors, Communications Hardware, Viewport Kit, Data Kit

Mission Planning Software: Flare™ ground station software suite

Range: 3+ mi (+4.8km); 10,000ft ceiling

Flight Time: 90 minutes

Distinctive Characteristics: Amphibious work-horse

When considering coastal UAS applications, amphibious platforms can offer unique versatility. Being able to land and recover a UAS on water adds functionality to applications. The F7200 models are made out of rugged composite materials and are much more durable than hobbyist level foams. They can be flown in various weather conditions as well.
                Nova F7200 models are equipped with The Fusion™, which are advanced Digital Single-Lens Reflex (DSLR)-based photogrammetric mapping payloads. All sensor data synchronizes to the microsecond and the on-board embedded computing and storage allows for comprehensive QA/QC throughout the process of data-acquisition. The payloads are swappable and can be customized to each mission. Data from Altavian multi-rotor platforms can be easily combined with data obtained from the Nova F7200 series.
                Altavian offers training packages as well. Training includes an instructor-led courses and 3 days of in-person training.
                While this tier of fixed-wing UAS is able to do everything a hobbyist level drone can do and more, using one for cinematic applications is overkill. Some good uses include mapping, monitoring coastal erosion and cliff stability, measuring the impact of flooding and other natural disasters, providing communities, insurance companies and/or financial institutions with inspection and investment data, and monitoring coastal vegetation.


High-Level Commercial


MSRP: Customizable; starts at $50,000.00 USD

Sensors: Epsilon 135 Gyro Stabilized Payload. Options include HD daylight and 640x480 Infrared night sensor; Onboard integrated image processor unit; H.264-encoded video in up to 720p HD

Operational Radius: 60 mi (96.6km); 15,000ft. Mean Sea Level (MSL) ceiling

Mission Planning Software: Piccolo Cloud Cap Technology Autopilot System

Flight Time: Over 20 hours

Top Speed: 32m/s / 62.2 knots (max level speed); 19-22 m/s / 37-43 knots (cruise speed)

Distinctive Characteristics: Can do it all.

The Penguin C UAV is equipped with a self-regulating, 28cc fuel-injected engine with a 100W onboard generator system that handles up to 55lbs takeoff weight. It is intended for long endurance and long range use. The system includes two UAVs, a ground control station, a tracking antenna system, and pneumatic launched and ground support equipment.
                UAV Factory also provides 15 day mission planning, flight operation and equipment maintenance training. The vehicles are fully autonomous and the ground control station is it's own robust platform.
                The Penguin C has many safety features. It allows pilots to be runway-independent with a catapult take-off, and includes a parachute recovery system (which includes Recovery Estimator software). Operator-caused errors can be avoided with Penguin Copilot software as well, which automatically executes safety decisions, utilizing its own integrated safety tree. All said features are autonomous.
                With over 20 hours of flight time and a 60 mile operational radius at your disposal, applications of the highest complexity are capable with this platform. In addition to missions mid-level drones can carry out, the Penguin C is capable of much more. The Penguin C has third party payload compatibility. With the right payload, it can assist military entities execute search and rescue, reconnaissance and surveillance missions.